

Background
The PresenceLearning (PL) platform was first built to function yet didn’t take into consideration the user journey and experience within the platform. This then created a culture were PL employees would work within the platform on behalf of the School Administrators and similar users. Therapists used the platform out of necessity but found many frustrating silo’ed products. Re-envisioning the user flow on our platform for Therapists and School Administrators by creating a easier to navigate hierarchy. Learning where the similarities are between the two user flows and how to create consistency while maintaining the different needs of the users.
Presence Learing
Roles: UX/UI Design Lead
Project Type: Collaborative
Problem
I was tasked to start understanding the current users and their journeys within the platform. Start identifying where we can be making more connections and how to build a permissions based platform that can, with slight differences between who’s logged in, encompass many different uses and also be open enough to allow expansion of our platform.
An additional problem that this was there to help move the company away from what was called “School Pages”. These school pages were google sheets that were used by PL employees to track data on schools. These sheets were very useful for many therapists in finding information on schools and districts. However these sheets were not unified and had varying amount of information. It also came into question what the source of truth came from, Salesforce data, School Pages, or the PL Platform. Creating the profiles is the start to give one source of truth and eliminate disagreeing forms of information.
Research and Interviews
I conducted countless interviews with my product manager to better understand the entire process that our Customers, School Admins, go through in order to work with PresenceLearning. We spoke with educators, therapists, as well as PL employees who are experts on our users and platforms. We found that many people needed to have paper folders and notebooks to help them track and supplement what they were doing in the platform. I also found that the Google Sheets that PL used to input and collect data from schools, was often times edited, so there was no consistency in the information. We gathered all the interview information and highlighted the standout points and ideas that were easiest to implement.
“It’s so hard to even get a student list from customers, I don’t think a lot of customers will login and update themselves.”
“We want to make sure we are seen as professionals”
“Providers didn’t understand they need to click tabs, and therefore do not see all the information they need.”
“School pages doesn’t allow for flexibility. Granting access to the Google Sheets is a huge process.”
“The layout is very overwhelming especially for Leads & Providers.”
“A lot of fields are empty because they are not needed or the information collected in other places”
User Journey / Flow
My first step on this project was mapping out the different user journeys. I hosted workshops for myself, my team, and additional stakeholders to start creating the current user journeys. We started by having different stakeholders meet with us and create the three current user journeys for Customers (Schools Admins), Providers (Therapists), and PL employees. This is how we found opportunities where the journey and flow could be simplified and also found where the different user journey’s connected. From there we created more ideal User Journey’s and grouped tasks together. We went through and created a cost vs impact grid to help determine which aspects of the journey were most needed and able to be worked on. This is how we determined our MVP.
User journey of the Customer (School Admin) and how there is a lot to do during onboarding them into the platform. Our goal was to make this better.


Design
The design was using currently used UI elements and reorganizing the data so that it was easier to comprehend and digest. Before the data was shown all at once, by organizing the data onto cards with similar information the user can then scan the page quickly to find the information they were looking for. We also brought in some basic data vis elements for quick reference and to also bring additional visuals to a page of mainly tables and data sets. This also was a way to surface other tools we had added and connect it to the location profiles.
In additional to rearranging data we also added some small helpful insights into the scheduling of the different locations and the users of those locations. This was to help surface any scheduling conflicts and help the School Administrators and Special Ed Directors better understand the upcoming weeks schedules and time
In all the designs I made sure to have all of the error cases worked out, and added some fun illustrations in when the user is successful!

Landing Page
Designing a landing page was where we started, to give a "home base" for the customer
With engineering we determined we would start work in this overall design flow with creating a specific landing page for our Customers. At this point when signed in they would go straight into the platform to the students list. This created a confusing experience and didn’t create any anchor point for the user. Creating a landing page was an easy to implement design with huge impact for the user, the best place to start.
We created a landing page that showed quick views of data and offered contextual links to the most used parts of the platform. We implemented the card design to make for a more modular and flexible layout. After the first release we got more feature requests and the layout allowed for quickly adding and modifying the experience.

Organization and Location Profiles
Our next part of this project was creating organization profiles. The hierarchy of our customers is that they have their Organization or District, which under that they have their school locations which serve the students. Before we didn’t display this hierarchy in the platform which was confusing to our therapists and customers. They would have to use the platform for location information, and then also use the Google Sheets to gather organization level information.
The new Organization page, this is at the District level for schools, the user then can see what schools are under the district/org and what students are being served therapy.

I created a nested organizing of the data, having the broadest information at the organization level then granular data at the location. Using breadcrumbs in the header it helps the user know they are “drilling down” into information. Within both profiles we started grouping and organizing data onto the card system we started on the landing page, to marry the experience together.
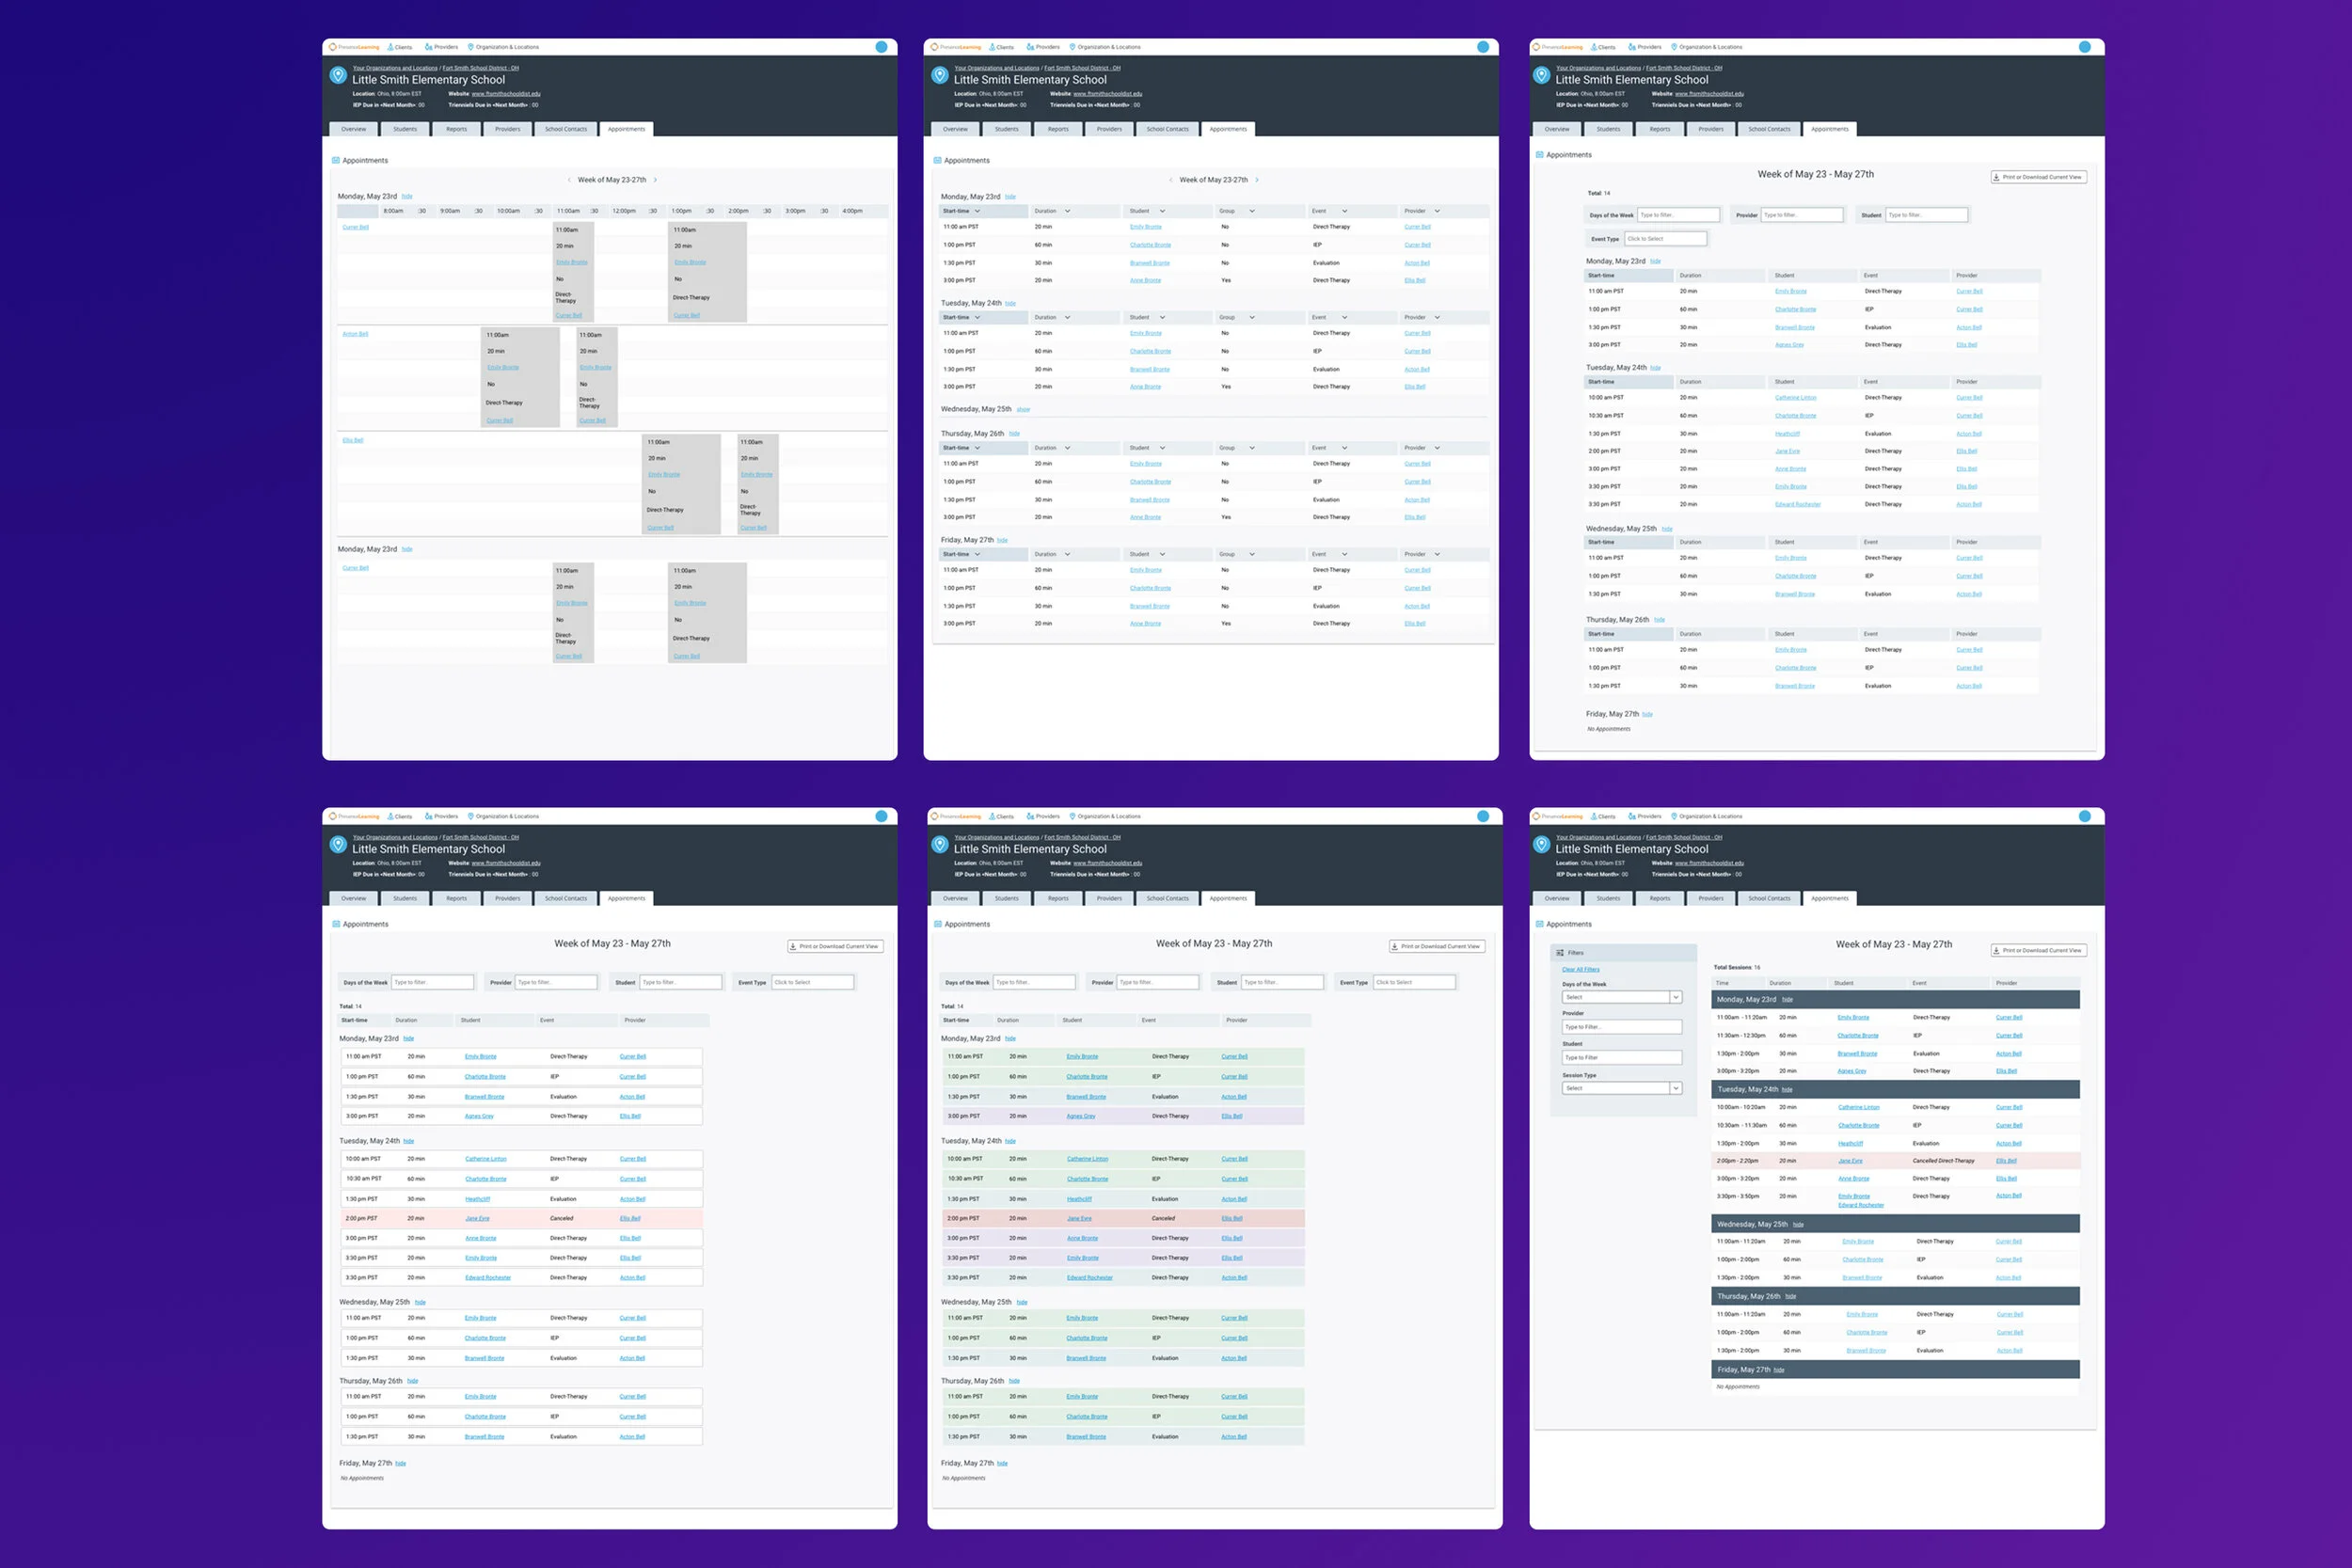
We started with testing quick sketches for our location appointments idea to make sure that the stakeholders could give fast input before we built anything.
I went through many different wireframe layout ideas and met with engineers in order to determine the path forward.
Redesigning the Location page for schools within large districts. This allows both Therapist and School Admins to access student data at the school fast.

Location Appointments
After the first release of the org and location profiles we received a lot of feedback from users on how to make the experience more worthwhile. The first additional feature we created after first release was an area in the Location profile where the user can see all the therapy appointments for the week. This is extremely helpful for teachers and administrators to know what the schedule will be, what students need to be where and when, as well as seeing when students are not available for appointments. This was a feature to help replace the multiple notebooks we found many users keeping in order to keep track of the weekly appointments, with that in mind we made a printer friendly version, so that users can print and take notes if needed.

With testing our idea we found out what the pain points were of the users were:
- When heavy into testing/evaluations. Those students aren’t on the master schedule. She’s wearing several hats, and it’s difficult to remember all of the scheduling details for evals. She learns about these updates early in the week. It’s difficult keeping track
- Pain points are having to coordinate at other school locations when everyone will be needing space and knowing students are absent.
- Without a weekly schedule it’s very frustrating. SHe tries to provide the teachers the schedules. She tries to give a copy but it’s a 5 page doc. So She sends a schedule of just their students or one grade (good idea to show grade level).
I went through many different designs on how to display the weekly agenda. We landed after testing sketches with a more table like grouping of information and the ability to collapse days and filter. This product proved to be on the scale of effort vs impact something that has a huge positive impact for users and was easier for the team to implement.
I create specs for each section for the pages, make sure they are modular, and use the CSS labels that is in our style sheets.
The final responsive page.

Release and Learning
Users felt with this release that we had added more information, when in actuality we showed a similar amount but better organized it and showed it in one place. This shows me that the users were fatigues with the amount of data and not fully digesting it. Now they could look it over in more bite sized amounts and better understand it. This shows what we had assumed, that the data wasn’t organized in an easy fashion for reading and comprehension. We also created a framework to start having the ability to add features more often to the product in more of an agile fashion rather than designing a waterfall release of the past.